You are here
CO2 Emissions: China vs US
In response to a comment about global warming, I looked up the data for CO2 emissions from the US and China over the last 25 years and made the plots below. The data are from the Energy Information Administration's "Official Energy Statistics from the U.S. Government" on the web here. The data represent emissions of CO2 from the consumption and flaring of fossil fuels. The first plot shows that since 1980, the U.S. has released 2 times as much carbon dioxide as China has. 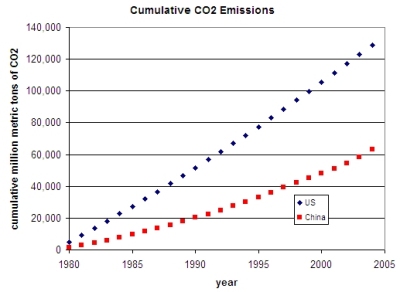
The second shows that the contrast is even greater per capita (per person): each year since 1980 the U.S. has released between 4 and 10 times as much CO2 per person as China. 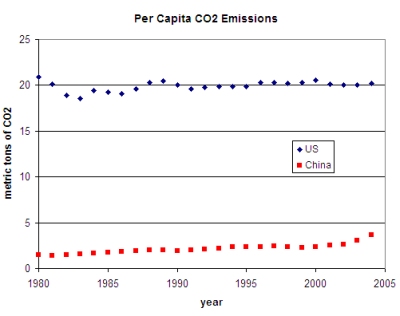
The third plot shows that there is reason to be cocerned about China. Though in recent years the U.S. has continued to emit more CO2 than China, China's emissions are accelerating drastically and will eclipse ours. 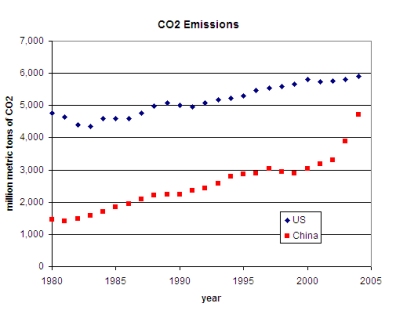
Theme by Danetsoft and Danang Probo Sayekti inspired by Maksimer
Comments
re: CO2 Emissions: China vs US
It looks like China is almost up to us. Add them to the rest of the world - where do we stand.According to reported energy statistics, coal production in China has returned to levels characteristic of mid 1990s levels. As a result, Chinese fossil-fuel CO2 emissions reached an all-time high of 1131 million metric tons of carbon in 2003. Even with the decline in Chines emissions from 1996 to 2000, China's industrial emissions of CO2 have grown phenomenally since 1950, when China stood tenth among nations based on annual fossil-fuel CO2 emissions. From 1970 to 1996, China's fossil-fuel CO2 emissions grew at an annual rate of 5.3%. From 1990-96 alone, emissions from fossil-fuel consumption and cement production rose 39%. Growth has occurred largely in the use of coal, not suprising given China is the world's largest coal producer, which accounted for 98.7% of the total in 1950 and 71.2% in 2003. Liquid fuels now contribute 16.5% of emissions and have grown appreciably over the past decade. The anomalous peak for 1958-61 is common in Chinese data. These years are part of the period "The Great Leap Forward," and whether the anomaly represents a real event in CO2 emissions or a data residual is not clear. China is the world's largest hydraulic cement producer. In 2003 China produced an estimated 862 million metric tons of hydraulic cement, or roughly 43% of the world's supply. Emissions from cement production account for 10.4% of China's 2003 total industrial CO2 emissions. China's population has doubled over the past four decades and now exceeds 1.3 billion people. Per capita emissions increased considerably over this period but their 2003 rate of 0.86 metric tons of carbon is still well below the global average.But how is a gas tax going to solve the problem?
re: CO2 Emissions: China vs US
See my response to your original comment here. There I list some of the reasons that a higher gas tax is advocated by some. I agree that CO2 emissions isn't only a U.S. problem...I was just objecting to the "way more" claim in your comment "China and other countries contribute way more to carbon monoxide emissions than the US does because of the environmental polices we have in place."The U.S. was responsible for about 22 % of global CO2 emissions in 2004 and China about 17 %. Russia, India, and Japan represent about 5 % each.